the Sim Settlements forums!

Register a free account today to become a member! Once signed in, you'll be able to participate on this site by adding your own topics and posts, as well as connect with other members through your own private inbox!

Long Save Research Tool

At least one more:


; When we open another barter menu before the previous one has finished processing (ie. before getting to the end of the ProcessBarterSelection function), we set this to avoid ProcessBarterSelection removing all of the items from our inventory
Debug.Trace("Function starting!")

Other format you might run into is:

;/ another
comment format
this comment can have returns
/;
Hmm, that one will be tricky, cause the ; is not at the beginning of the line and if I look for ; and function in the same line I might not place a trace where it should be one... got to think about that one for a sec.


As the comment blocks, it is adding traces, but since they are inside a comment block it shouldn't throw any compilation error. But I'll strengthen the verifications so it skips comments blocks.
 
Hah, sorry mate.... I've been paying attention to the updates re: your tool, and these papyrus "comments" are just blowing my mind. I mean, using ';' !?!?! You're on the right track with regards to using regex. It's been years, but I remember spending hours trying to tweak a regex pattern to be perfect. If I have any inspiration, I'll be sure to get in touch!
 
Hah, sorry mate.... I've been paying attention to the updates re: your tool, and these papyrus "comments" are just blowing my mind. I mean, using ';' !?!?! You're on the right track with regards to using regex. It's been years, but I remember spending hours trying to tweak a regex pattern to be perfect. If I have any inspiration, I'll be sure to get in touch!
I'm actually using a combination of simple comparison, ignore case comparison and Regex to filter this xD the code is far from optimized, but it still edits 1000+ files in less than a second, so I'm not too worried about optimization xD

take a look at the rep if you're curious :) https://github.com/nosfsos/PSCDebugger
 
At least one more:


; When we open another barter menu before the previous one has finished processing (ie. before getting to the end of the ProcessBarterSelection function), we set this to avoid ProcessBarterSelection removing all of the items from our inventory
Debug.Trace("Function starting!")

Other format you might run into is:

;/ another
comment format
this comment can have returns
/;
I think I got it, but there are too many lines to check by hand :blush
1643110600528.png
Sorry for all the trouble @kinggath! I hope this is the one. What it currently does:
  • skips lines starting with ;
  • skips lines starting with ;/ and flags for it being inside a comment block
  • skips lines ending with /; and remove the flag for being inside a comment block
  • skips lines starting with {
  • skips events using the same logic stated above (it was adding trace when the events returned something)
  • skips empty lines
  • skips lines with only \t
  • in case of a line contains ; in the middle (meaning its a comment after something) it will ignore if it detects any of the trigger words after the ;
    • this one might be skipping lines where it should add a trace. I'm not 100% sure of this
  • if passes all the above validations, then it idents and adds the trace line according
  • writes the new files in the target directory so it won't override the original files

Git updated, .exe in attachment :)

fingers crossed
 

Attachments

  • Debugger.zip
    11.2 KB · Views: 5
Last edited:
I think I got it, but there are too many lines to check by hand :blush
View attachment 15287
Sorry for all the trouble @kinggath! I hope this is the one. What it currently does:
  • skips lines starting with ;
  • skips lines starting with ;/ and flags for it being inside a comment block
  • skips lines ending with /; and remove the flag for being inside a comment block
  • skips lines starting with {
  • skips events using the same logic stated above (it was adding trace when the events returned something)
  • skips empty lines
  • skips lines with only \t
  • in case of a line contains ; in the middle (meaning its a comment after something) it will ignore if it detects any of the trigger words after the ;
    • this one might be skipping lines where it should add a trace. I'm not 100% sure of this
  • if passes all the above validations, then it idents and adds the trace line according
  • writes the new files in the target directory so it won't override the original files

Git updated, .exe in attachment :)

fingers crossed
Testing this now, will edit this post and lyk if it works! I select the Scripts folder in Fallout 4/Data, and set the Target Directory as steamapps/common/Fallout 4, right?

UPDATE: I wasn't sure which directory to select, so I selected what I said above. Papyrus1 is when I first ran it-- the 2nd to last quick-save I made took over 30 seconds, which I consider abnormally long (as it's usually less than a couple of seconds).Papyrus0 is the second time I ran it. I loaded up in Sanctuary and fast travelled to and from Red Rocket Truck Stop. The fast travelling took a hot minute, but when I went back to the settlement, quicksaving and autosaving both worked fine. Hopefully the two together will offer some help. Let me know if there's any more ways I can help!
 

Attachments

  • PapLogs.zip
    47 KB · Views: 0
Last edited:
once it is working correctly, kinggath will give us a build of the mod with the traces them if you have papyrus logging enabled (https://www.creationkit.com/fallout4/index.php?title=Enable_Debug_Logging) you can see the prints.

The idea is to check the logs when a long saver happens and try to find correlations between function calls and long saves. :)
I updated this post:
Testing this now, will edit this post and lyk if it works! I select the Scripts folder in Fallout 4/Data, and set the Target Directory as steamapps/common/Fallout 4, right?

UPDATE: I wasn't sure which directory to select, so I selected what I said above. Papyrus1 is when I first ran it-- the 2nd to last quick-save I made took over 30 seconds, which I consider abnormally long (as it's usually less than a couple of seconds).Papyrus0 is the second time I ran it. I loaded up in Sanctuary and fast travelled to and from Red Rocket Truck Stop. The fast travelling took a hot minute, but when I went back to the settlement, quicksaving and autosaving both worked fine. Hopefully the two together will offer some help. Let me know if there's any more ways I can help!
Hopefully this helps, let me know if there's anything else I can do!

Also note, I believe that this issue occurs after a little time spent in-game. My theory is the scripts eventually get clogged up, and the allocated memory/cache allowed to run these scripts eventually gets overloaded. If it were a bad function, it'd occur off the bat... unless a global variable changes in a way that confuses the function, or makes it run abnormally long. Then again, knowing Bethesda, it's likely an issue caused by how the Fallout 4 engine works.
 
Testing this now, will edit this post and lyk if it works! I select the Scripts folder in Fallout 4/Data, and set the Target Directory as steamapps/common/Fallout 4, right?

UPDATE: I wasn't sure which directory to select, so I selected what I said above. Papyrus1 is when I first ran it-- the 2nd to last quick-save I made took over 30 seconds, which I consider abnormally long (as it's usually less than a couple of seconds).Papyrus0 is the second time I ran it. I loaded up in Sanctuary and fast travelled to and from Red Rocket Truck Stop. The fast travelling took a hot minute, but when I went back to the settlement, quicksaving and autosaving both worked fine. Hopefully the two together will offer some help. Let me know if there's any more ways I can help!
I have to use that tool on the uncompiled scripts, recompile them, and then I'll post new scripts. They aren't going to be useful scripts right away though, they are for something Mystical Panda is working on. That will hopefully result in a little package of stuff we can use to collect data on the long-saves and figure out where the problematic scripts are.

@nosfsos @Mystical Panda success! Attached a 7z with the scripts. Just extract the file to your Fallout 4\Data folder, and make sure you have loose files enabled: https://www.nexusmods.com/fallout4/...le Fallout 4 to,nothing after the equals sign).
 

Attachments

  • SS2_version200L_TraceSpamScripts.7z
    1.2 MB · Views: 4
I have to use that tool on the uncompiled scripts, recompile them, and then I'll post new scripts. They aren't going to be useful scripts right away though, they are for something Mystical Panda is working on. That will hopefully result in a little package of stuff we can use to collect data on the long-saves and figure out where the problematic scripts are.

@nosfsos @Mystical Panda success! Attached a 7z with the scripts. Just extract the file to your Fallout 4\Data folder, and make sure you have loose files enabled: https://www.nexusmods.com/fallout4/mods/4020/#:~:text=To enable Fallout 4 to,nothing after the equals sign).
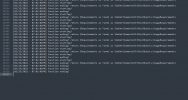
Well... good news/ bad news... good news, replacing the scrips worked, it is printing to the log.

The bad news is that it is extremely spammy and it doesn't give us enough information. Maybe we should use tracestack instead of trace?

1643137466148.png

Those 28k lines were the result of 30sec gameplay. I know that getting the whole stack call will make it even more spammy, but the way it is right now it is useless :(


EDIT: 2.5min long save, bur unfortunately I cannot tell which functions were being called, but definitely the save was called in the middle of a function call (which shouldn't be a problem, but some thing has to be the problem xD)

1643138232182.png

I'll modify the tool to add Debug.TraceStack instead of Debug.Trace
 
Last edited:
Here it is.

Sorry for that, I should have consulted the papyrus references before :(
 

Attachments

  • Debugber.zip
    11.2 KB · Views: 2
Just an fyi tracestack is going to be even more spammy - but definitely more useful! The stack will include lines for the preceeding 5 or 6 calls.

Waiting for compile to finish now...
 
yeah I know. If it works as in other languages, it should give the full stack (since the starting call, i.e., F1 calls F2 ... calls Fn and in Fn is the trace, then all of that goes to the stack)

But that way we can try to find correlations in the logs, and I also think the full stack will be more useful to what @Mystical Panda is doing :)

Thanks for the patience Kinggath!
 
Here you go!
 

Attachments

  • SS2_version200L_TraceStackSpamScripts.7z
    1.2 MB · Views: 5
I have to use that tool on the uncompiled scripts, recompile them, and then I'll post new scripts. They aren't going to be useful scripts right away though, they are for something Mystical Panda is working on. That will hopefully result in a little package of stuff we can use to collect data on the long-saves and figure out where the problematic scripts are.

@nosfsos @Mystical Panda success! Attached a 7z with the scripts. Just extract the file to your Fallout 4\Data folder, and make sure you have loose files enabled: https://www.nexusmods.com/fallout4/mods/4020/#:~:text=To enable Fallout 4 to,nothing after the equals sign).
Downloading it now... I've got a few more 'Q-i-D' tools to upload here in just a bit one is the 'stack trace' idea I've been tossing around. Hopefully, it'll be of some use. The other is an example of a very simple 'strings' things I mentioned earlier. I do have esp and bsa parsing libraries written, but they're not complete enough yet and need a lot refactoring (I threw them together based on immediate need) before they can be released. And I have a certain idea of what I'm wanting them to do other than just parsing and extracting information.

Let me get to hammering on this stuff...
 
Here you go!
It is working correctly now, but damn that's spammy xD

3min from game start to after long save -> 230k lines xD lol

At least it is working. @Mystical Panda for some strange :todd: reason, the TraceStack function don't know the name of the function it is being called from. I dunno why I excepted something different from good old Todd xD

Let me know how can I tweak the logs so it is better suited for what you're doing. If you don't need the full stack, but just the function signature, I can easily change the tool to do that and the log will be considerably less spammy.

Also, once you narrow it down, I can change the tool to only add debugs to certain scripts. At this point, I think you're the one closest to finding anything, so just let me know how can I assist you :)
 

Attachments

  • 1643147946404.png
    1643147946404.png
    119.2 KB · Views: 7
Well... good news/ bad news... good news, replacing the scrips worked, it is printing to the log.

The bad news is that it is extremely spammy and it doesn't give us enough information. Maybe we should use tracestack instead of trace?

View attachment 15300

Those 28k lines were the result of 30sec gameplay. I know that getting the whole stack call will make it even more spammy, but the way it is right now it is useless :(


EDIT: 2.5min long save, bur unfortunately I cannot tell which functions were being called, but definitely the save was called in the middle of a function call (which shouldn't be a problem, but some thing has to be the problem xD)

View attachment 15301

I'll modify the tool to add Debug.TraceStack instead of Debug.Trace
I'm working on an initial 'guess' that during the freezing process the VM prevents newer script instances from running, but tries to freeze or stop and existing one which is the middle of something. The script could be frozen if the function actually returns and the stack frame is at a point where the variables are recorded. But the actual function is triggering other events in a script that's STILL trying to freeze so it's not frozen or in-active. The VM is saying... I'll let you do what you need to do so I can freeze you. I've frozen others from starting a new stack frame, but your frames are already 'open' and 'in-use', so get done. But it can't because the same script is firing off more stack frames calling itself, or other functions within itself. Therefore a multi script recursion. Long save and stack dumps.

Now to the stack dump part. If, for any reason, a certain instance arises where this type of recursion happens, you'll get a fast dump of deeper or new stack frames. The VM can't handle this, not necessarily because it's too many too fast, but the VM itself is mitigating access to a shared reference or resources (such as the workbench materials list) between many scripts and that delay is enough to cause stack frame instances to start piling up upon each other- an exiting one was granted access to the shared reference or resource and immediately fires off another request while others are still waiting for their initial 'get' request to complete for the same shared reference or resource. It'll pile up fast.

Which if they recurse each other it'll get out of hand in a matter of ms. Thus the stack dump warning. Which is basically the VM staying that it has too many 'waiting' scripts so "I'm going to show you the ones over the set limit'- thus the dump in the papyrus.

I'm absolutely not sure if this is how the VM works without an engine level debugger with function call mapping. Just tossing that out there.
 
It is working correctly now, but damn that's spammy xD

3min from game start to after long save -> 230k lines xD lol

At least it is working. @Mystical Panda for some strange :todd: reason, the TraceStack function don't know the name of the function it is being called from. I dunno why I excepted something different from good old Todd xD

Let me know how can I tweak the logs so it is better suited for what you're doing. If you don't need the full stack, but just the function signature, I can easily change the tool to do that and the log will be considerably less spammy.

Also, once you narrow it down, I can change the tool to only add debugs to certain scripts. At this point, I think you're the one closest to finding anything, so just let me know how can I assist you :)
Awesome! Give me some time to get a quick utility app done and I'll start 'digesting' it. I'm guessing there's an intrinsic function that's called that can't complete, thus the freeze and dumping. Just a guess though.
 
It is working correctly now, but damn that's spammy xD

3min from game start to after long save -> 230k lines xD lol

At least it is working. @Mystical Panda for some strange :todd: reason, the TraceStack function don't know the name of the function it is being called from. I dunno why I excepted something different from good old Todd xD

Let me know how can I tweak the logs so it is better suited for what you're doing. If you don't need the full stack, but just the function signature, I can easily change the tool to do that and the log will be considerably less spammy.

Also, once you narrow it down, I can change the tool to only add debugs to certain scripts. At this point, I think you're the one closest to finding anything, so just let me know how can I assist you :)
Oh yeah, it's going to be with the number of scripts and functions (such as onload where there are literally hundreds if not thousands of objects being loaded) being called. Such as when scripts are 'attached' to world objects.

Yes, in time, if this is useful it can be 'targeted' rather than 'blanketed' script wise to help debug very complex scripted solutions.
 
Well... good news/ bad news... good news, replacing the scrips worked, it is printing to the log.

The bad news is that it is extremely spammy and it doesn't give us enough information. Maybe we should use tracestack instead of trace?

View attachment 15300

Those 28k lines were the result of 30sec gameplay. I know that getting the whole stack call will make it even more spammy, but the way it is right now it is useless :(


EDIT: 2.5min long save, bur unfortunately I cannot tell which functions were being called, but definitely the save was called in the middle of a function call (which shouldn't be a problem, but some thing has to be the problem xD)

View attachment 15301

I'll modify the tool to add Debug.TraceStack instead of Debug.Trace
One thing it does show you is the VM load based on the script function calls. That's a good thing as this is where SS2 is hitting the games VM the hardest.
 
Hmm, that one will be tricky, cause the ; is not at the beginning of the line and if I look for ; and function in the same line I might not place a trace where it should be one... got to think about that one for a sec.


As the comment blocks, it is adding traces, but since they are inside a comment block it shouldn't throw any compilation error. But I'll strengthen the verifications so it skips comments blocks.
I haven't looked at the script code yet, but could you trim the start and end of the line of white spaces, then check for the actual comment of ";/", then from that position in the text + length of the comment (";\" - 2 chars), look for the next comment, then add the length of the comment (which is 2).

This would give you the start and end of the commented section to retrieve.
 
Top